
This resource focuses on active fire maps, or live fire maps, across multiple regions. Have a new map to suggest for a new region? Let us know in the comments.
Live Drought Monitor Maps
European + Global
joint-research-centre.ec.europa.eu
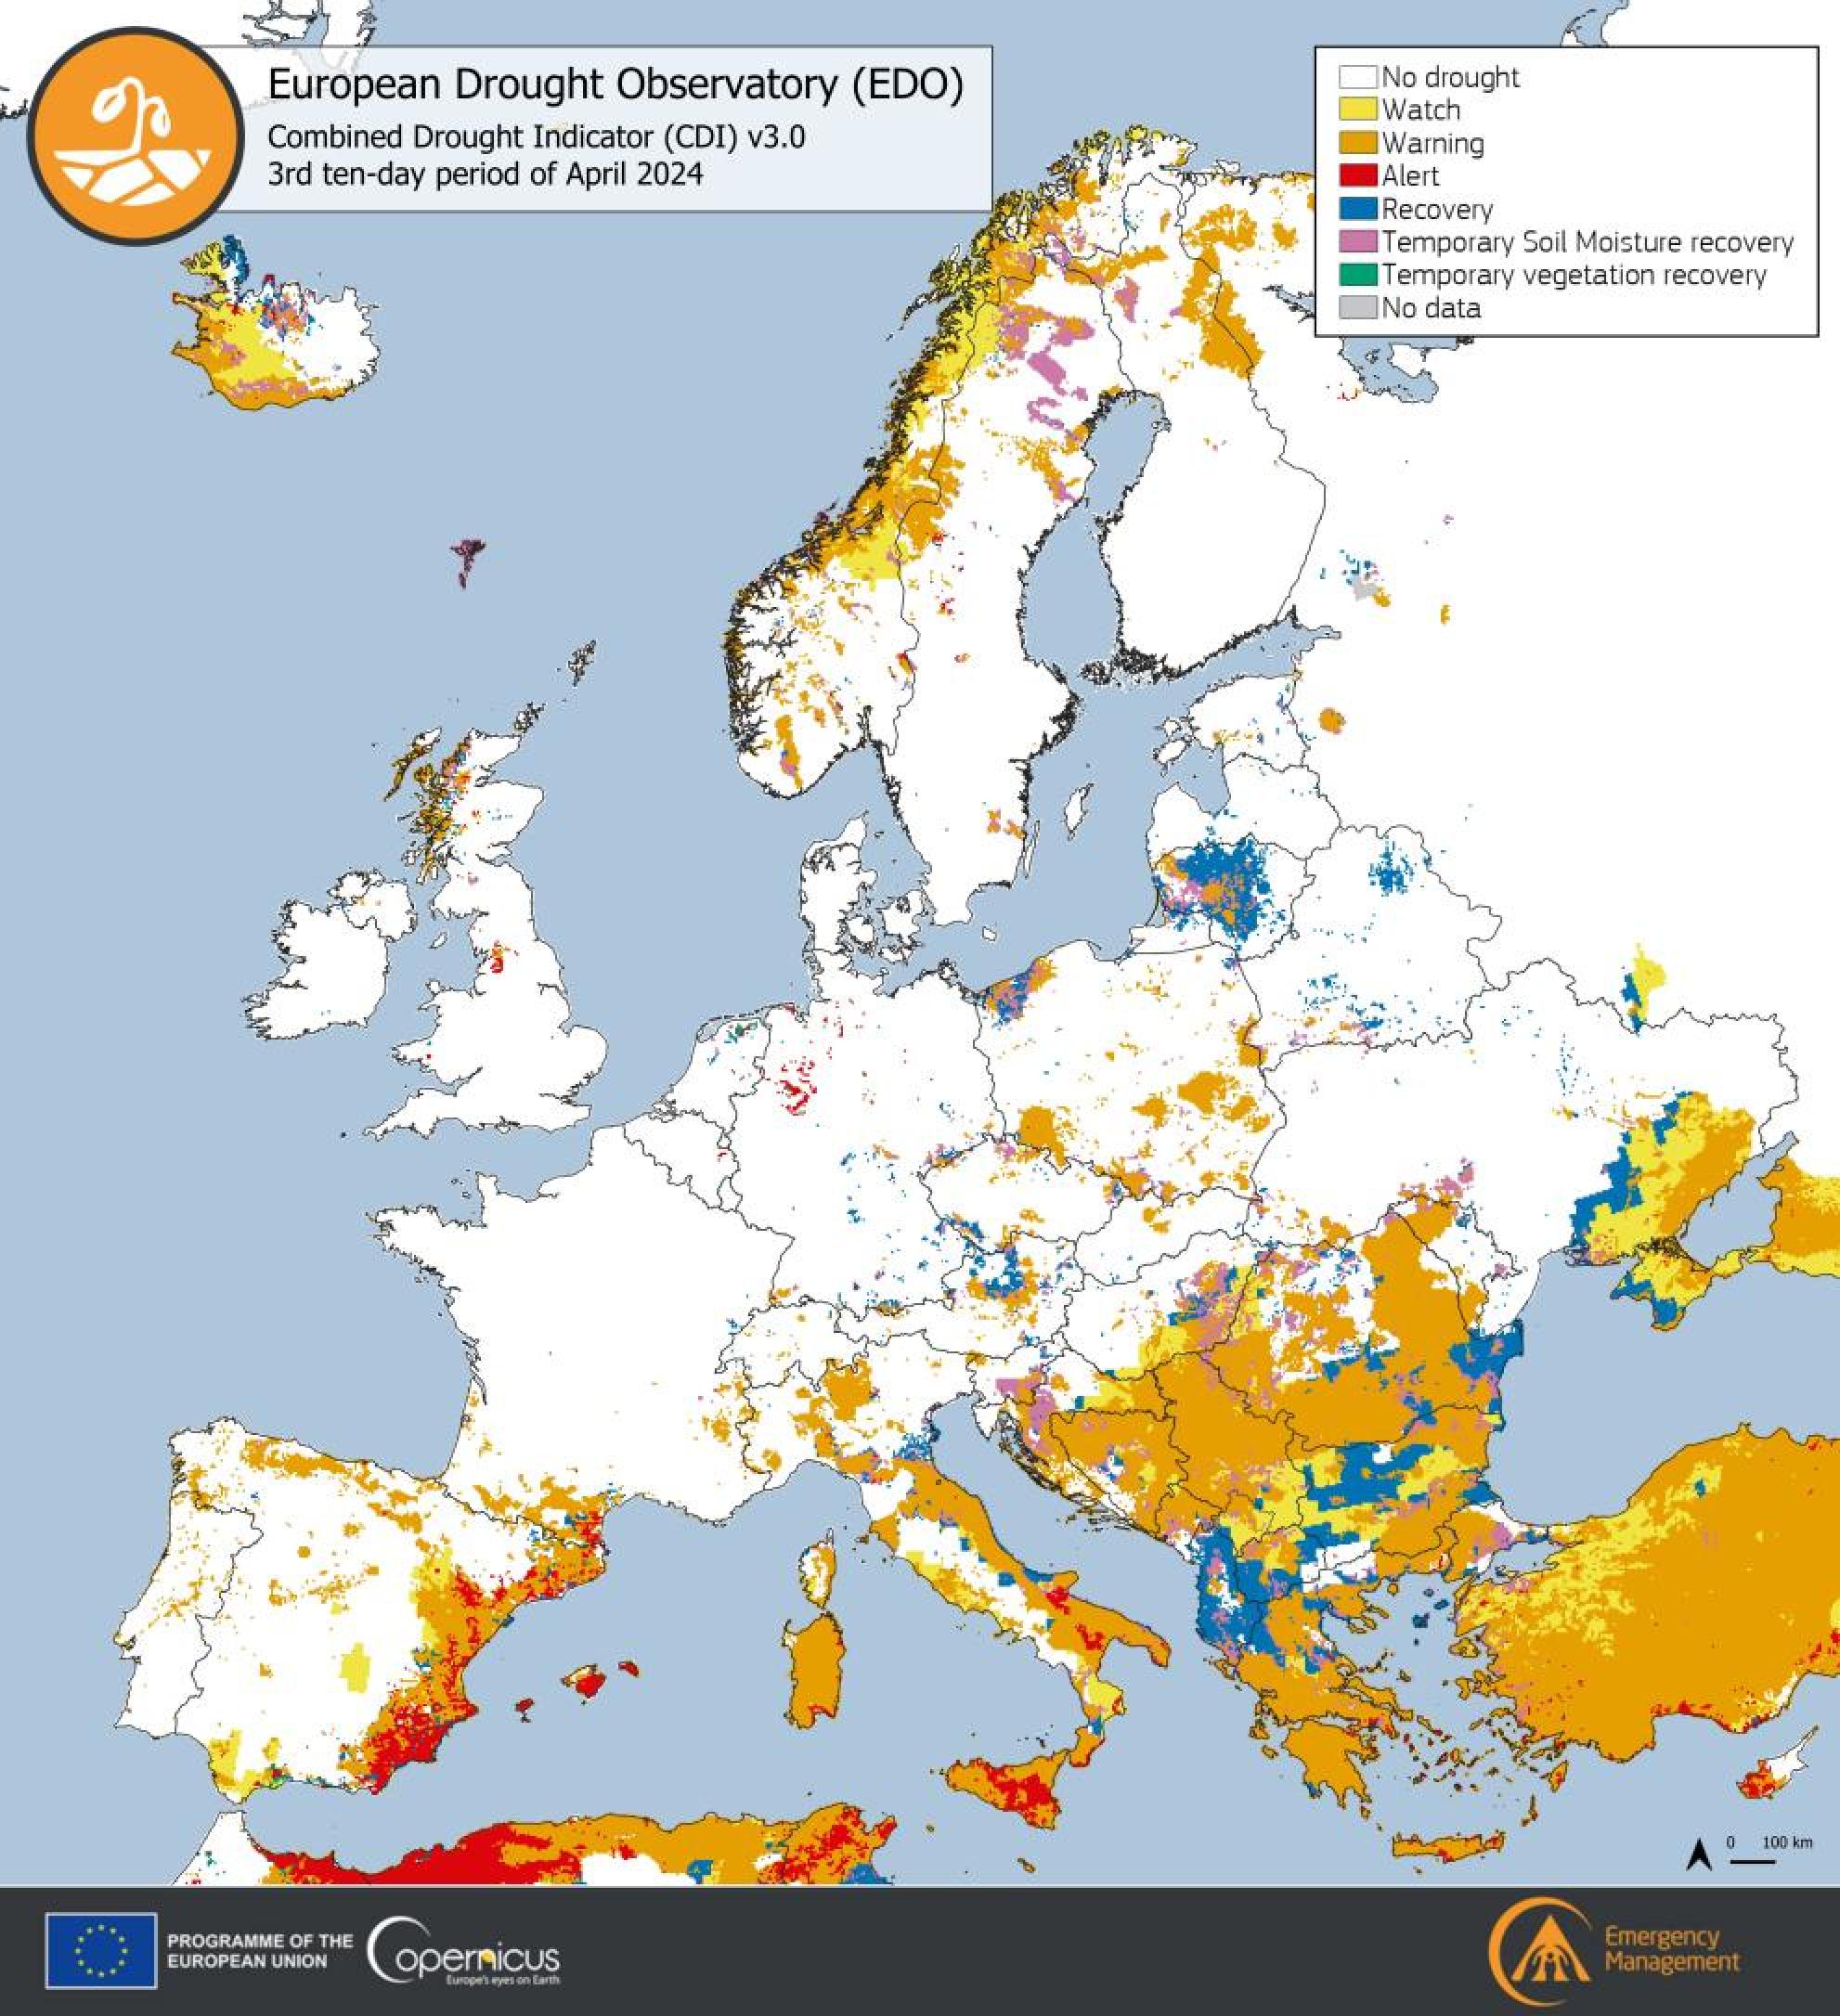
From the European and Global drought map, you can find either the european or global mapviewer that details rainfall, temperature, heatwave, soil moisture, vegetation health, lowflow and groundwater availability.
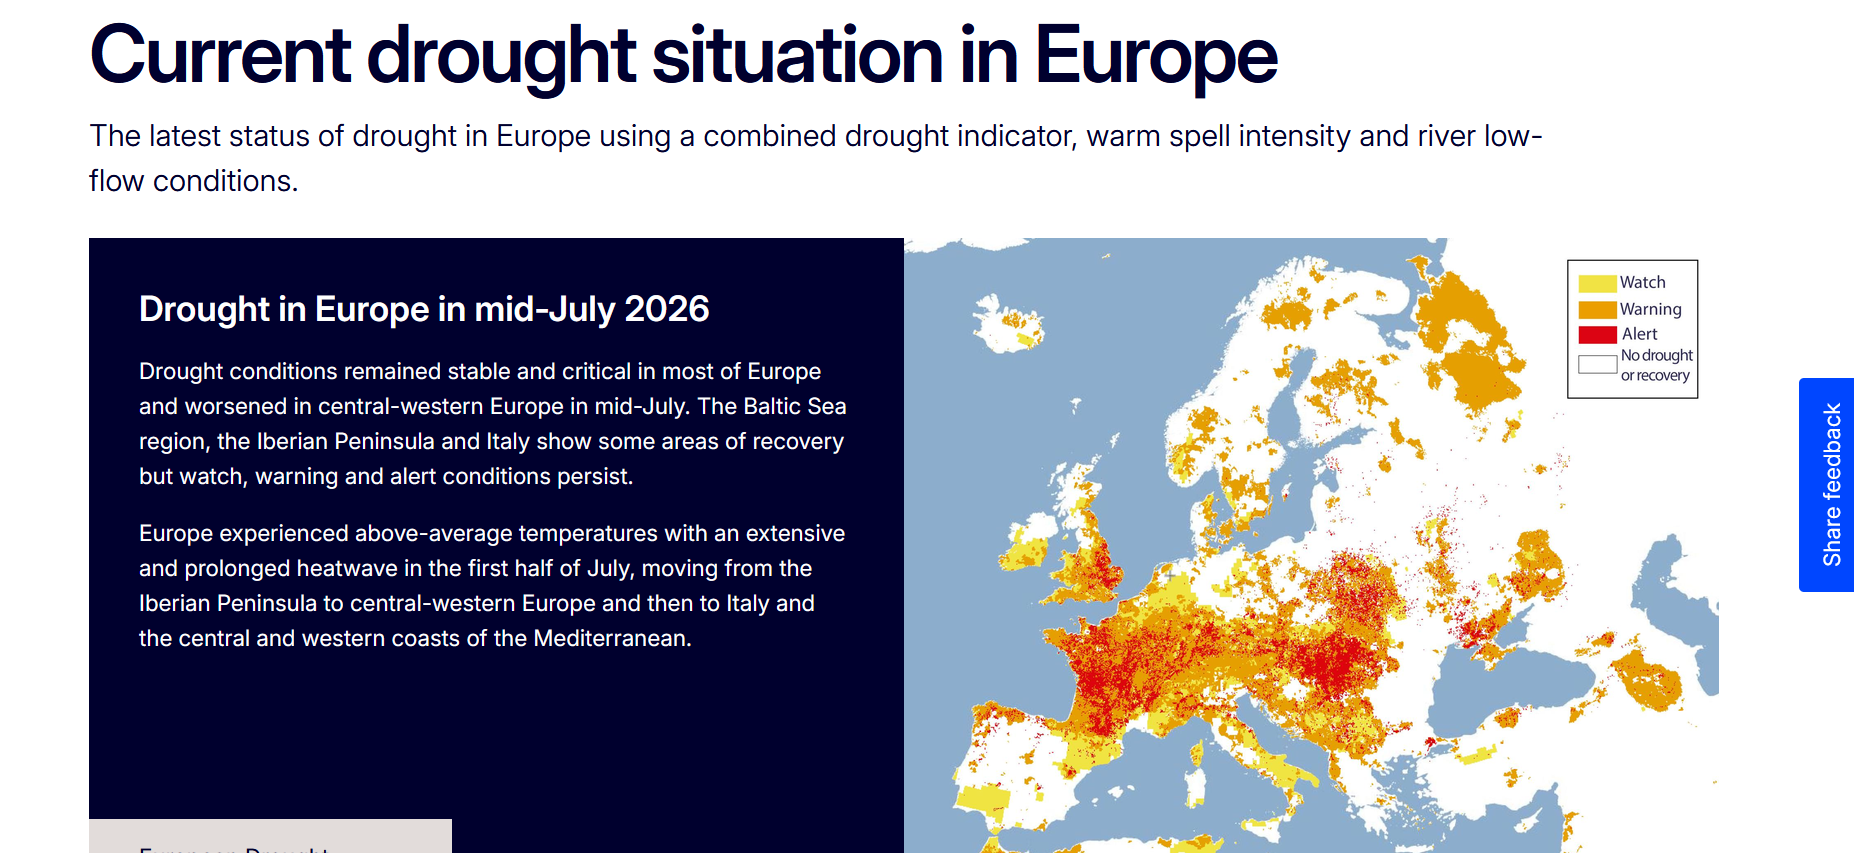
You can also view ad-hoc drought reports published by Copernicus Emergency Management Services sorted by year. Drought-related news and additional learning is linked at the bottom of the page.
The current conditions map is highlighted with two legend colors, each indicating either a watch, warning, or alert for drought. Using the Mapviewer, you are taken to an interactive map with the ability to pan and zoom across different countries.
United States
Here, Drought.gov offers a monitor map on the front page, with tabs for 30-day precipitation and 30-day temperature. The color legend provides the level of drought as well as the percentage of the United States that is under the drought, as well as a total area.
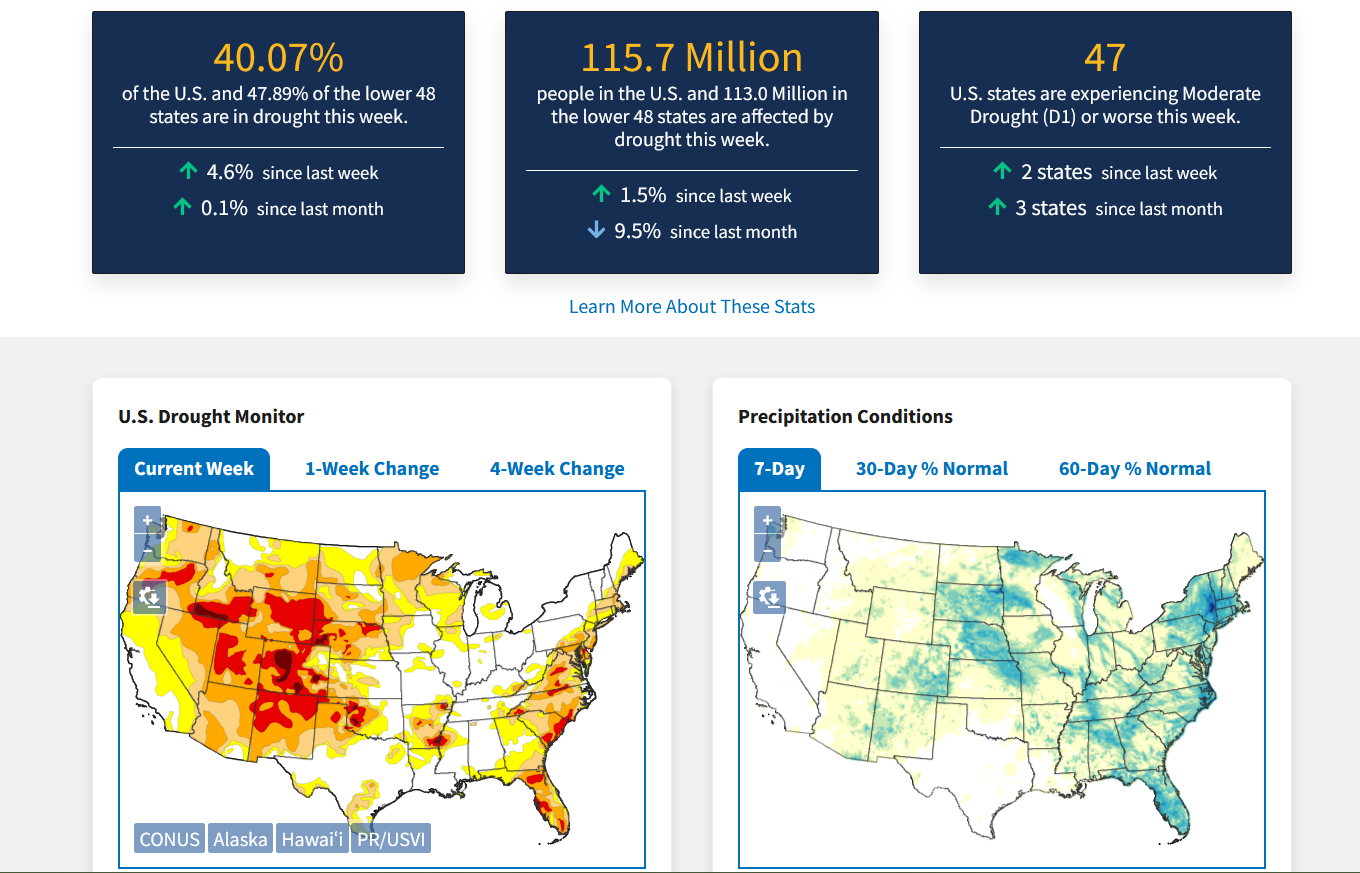
Maps are released weekly on Thursdays, with data valid until Tuesdays.
Clicking on Current Conditions underneath the map will bring up more detailed conditions with a statement and several change graphs, as well as several more map types related to drought, precipitation, and temperature.
Alternatively, clicking on an individual state on the map will bring you to a particular conditions page for that state. You can find many of the details from the Current Conditions page on these individual pages, except they are tailored to the state it represents.
0 Comments